It's the first week of the month. The PDF lands in your inbox. Forty-two pages.
Impressions up 31%. Click-through rate up. "Leads: 118." Green arrows down the right side like a stock chart in a good year.
You read it in the truck between jobs. Then you open your scheduling software and try to find the 118.
You can't. Not because they aren't there — some of them probably are — but because nothing in those 42 pages connects to anything in your business. The report measures what the vendor does. It does not measure what your money did.
This is the first thing to understand about the Black Box: it reports what it wants you to see. Not lies. Just the wrong numbers, arranged to look like the right ones.
What each number actually means
Take the standard report apart, metric by metric, and say plainly what each one counts.
| The report says | What it actually counts | What it tells you about jobs |
|---|---|---|
| Impressions | Times Google or Meta displayed something with your name on it | Nothing |
| Clicks | Times someone tapped it | Nothing — tappers include competitors, bots, and people who bounced in two seconds |
| CTR | Clicks ÷ impressions | How good the ad text is at getting taps. Still nothing about jobs |
| CPC | What you paid per tap | Cost of a thing that isn't a job |
| "Leads" | Form fills + phone calls, usually any call over 30 seconds | Some of these are jobs. Also: spam, the guy asking for directions, a supplier, a tire-kicker, an existing customer calling about their invoice |
| Cost per lead | Spend ÷ the number above | Cost of a bucket that mixes a $12,000 system replacement with a wrong number |
None of these are fake. All of them are upstream of the only thing you care about: did the phone ring with a person who booked, and what was the job worth?
The one row that isn't there
Here's the row a report should have. Write it on the back of yours if you have to.
Spend → Calls → Booked jobs → Revenue → Cost per booked job
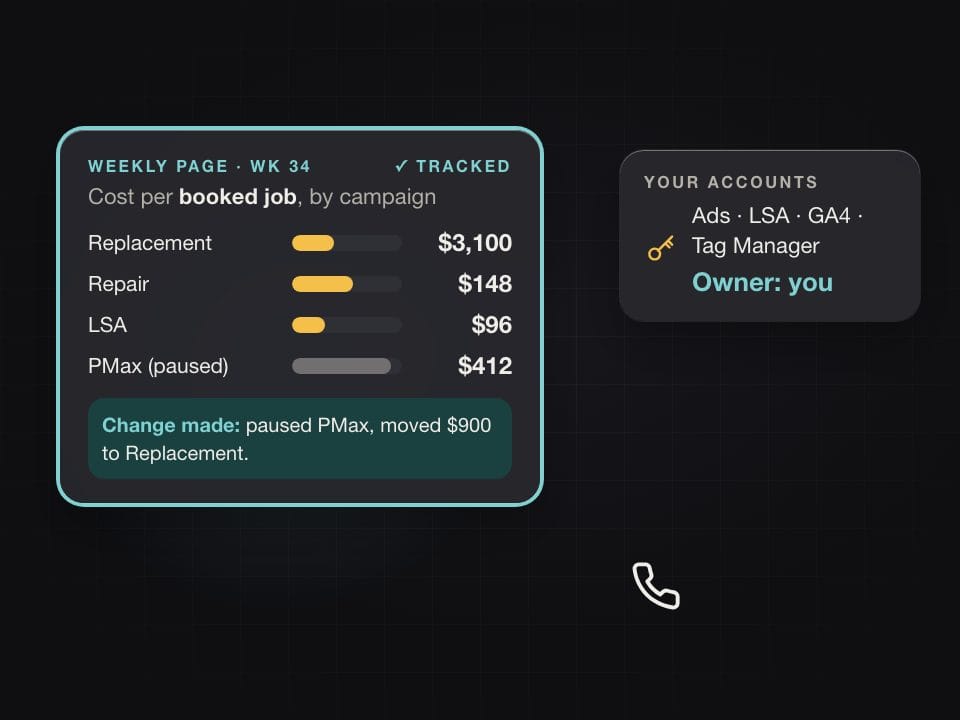
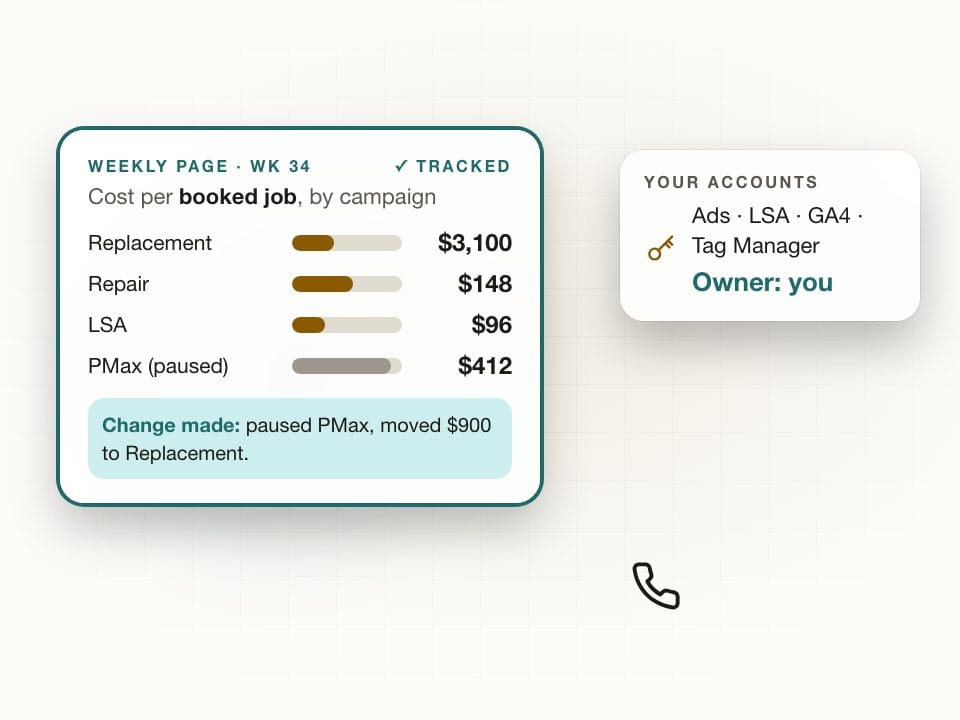
Your report had 118 "leads." Here's a smaller, cleaner month for a mid-size HVAC company, so the math fits on one screen:
| Item | Item |
|---|---|
| Spend | $6,000 |
| Calls + forms | 41 |
| Qualified (real customer, in service area) | 28 |
| Booked | 19 |
| Revenue from those 19 | $29,220 |
| Cost per booked job | $316 |
| Return on spend | 4.9× |
Now split the 19:
| Job type | Count | Avg ticket | Which campaign |
|---|---|---|---|
| Tune-up / maintenance | 13 | $189 | "AC tune-up special" |
| Repair | 4 | $740 | Brand search |
| System replacement | 2 | $11,900 | "AC replacement financing" |
Look at what that split does. The tune-up campaign generated the most "leads" — it would be the star of the 42-page report. The replacement campaign generated two. But those two are half the revenue, and the ad that produced them is probably underfunded because, by the vendor's metrics, it "performs worse."
The report with 118 leads in it can't tell you this. A report with the row above tells you in ten seconds.
Why the box stays closed
Give the vendor the benefit of the doubt for a second. Building the real row is harder. It needs call tracking that records outcomes, not just durations. It needs someone to mark calls as booked or not. It needs your job values — which means the agency has to ask you for them, every month, and actually use them.
But that's a week of setup, once. It isn't the reason.
The reason is that a report showing cost per booked job would also show the months when it's bad. A report showing impressions never has a bad month — there are always more impressions. The Black Box stays closed because opening it creates accountability, and accountability is the thing the model is built to avoid.
An agency that's confident in its work wants you to see the row. One that isn't wants you to see the arrows.
“I'm paying people to tell me things I can't check.”
Not just HVAC
The same trick, different verticals:
- Plumbing: "Emergency plumber" campaign runs all night. Calls count as leads. Nobody mentions that the after-hours calls went to voicemail and became someone else's jobs.
- Roofing: 60 "leads" from a lead seller — and 20 of them were sold to two other roofers the same afternoon. The report counts 60.
- Law firms: "Leads: 34." Signed cases: 3. Cost per signed case: nowhere on the page, and it's the only number the partners care about.
- Ecommerce: "ROAS 4.1×." Meta and Google both claimed the same order. Returns and COGS aren't subtracted. The real number is closer to 1.3×, which is break-even.
Every one of these is the same move: report the number that goes up, hide the number that pays the bills.
What to do with this month's report
You don't need new software to start. Do this with the report you already have:
- Find the "leads" number. Ask the agency for the list behind it — every call and form, with timestamps and recordings.
- Mark each one yourself. Booked / not booked / not a customer. Takes 30 minutes for 100 leads.
- Add job values to the booked ones from your own system.
- Divide. Spend ÷ booked = cost per booked job. Revenue ÷ spend = real return.
- Send it back. "Here's the row I need at the top of next month's report." Watch what happens.
If they build it, good — you've just opened the box. If they can't, or won't, or explain why impressions are really the thing to watch, you've learned what the 42 pages were for.
The two-minute version
If you'd rather not do the spreadsheet, the Leak Check asks three questions — can you tie spend to booked jobs, do you own your accounts, how fast does a lead get a human — and scores where the money is leaking. No email required to see the score.
Sources & notes
- Google Ads Help: impressions, clicks, and conversion definitions
- FTC v. HomeAdvisor (2023 order) — lead-quality claims
- Google Local Services Ads Help: ranking factors, response time
- Worked numbers are synthetic composites, not client data.